
Rob Ennis
You can download a PDF of my complete CV here
Research Overview (selected work)
The color appearance of curved transparent objects
We extended the study of transparent colors from flat, 2D filters to curved, 3D objects, and used various color matching paradigms to evaluate the effectiveness of competing models. Our results supported the RMD as the mechanism for transparent color appearance, and rejected the RSD model as a determined of color appearance, but found that the RSD could be related to the perceived clarify of glass objects.
Statistical tools used:
- Image analysis & color statistics
- Vector calculus
- Model fitting & prediction error
- Model comparison
Programming tools used:
- R
- Matlab/Octave
- Golang
- GLSL
Related Github repos:
Retinal adaptation abnormalities in primary open-angle glaucoma
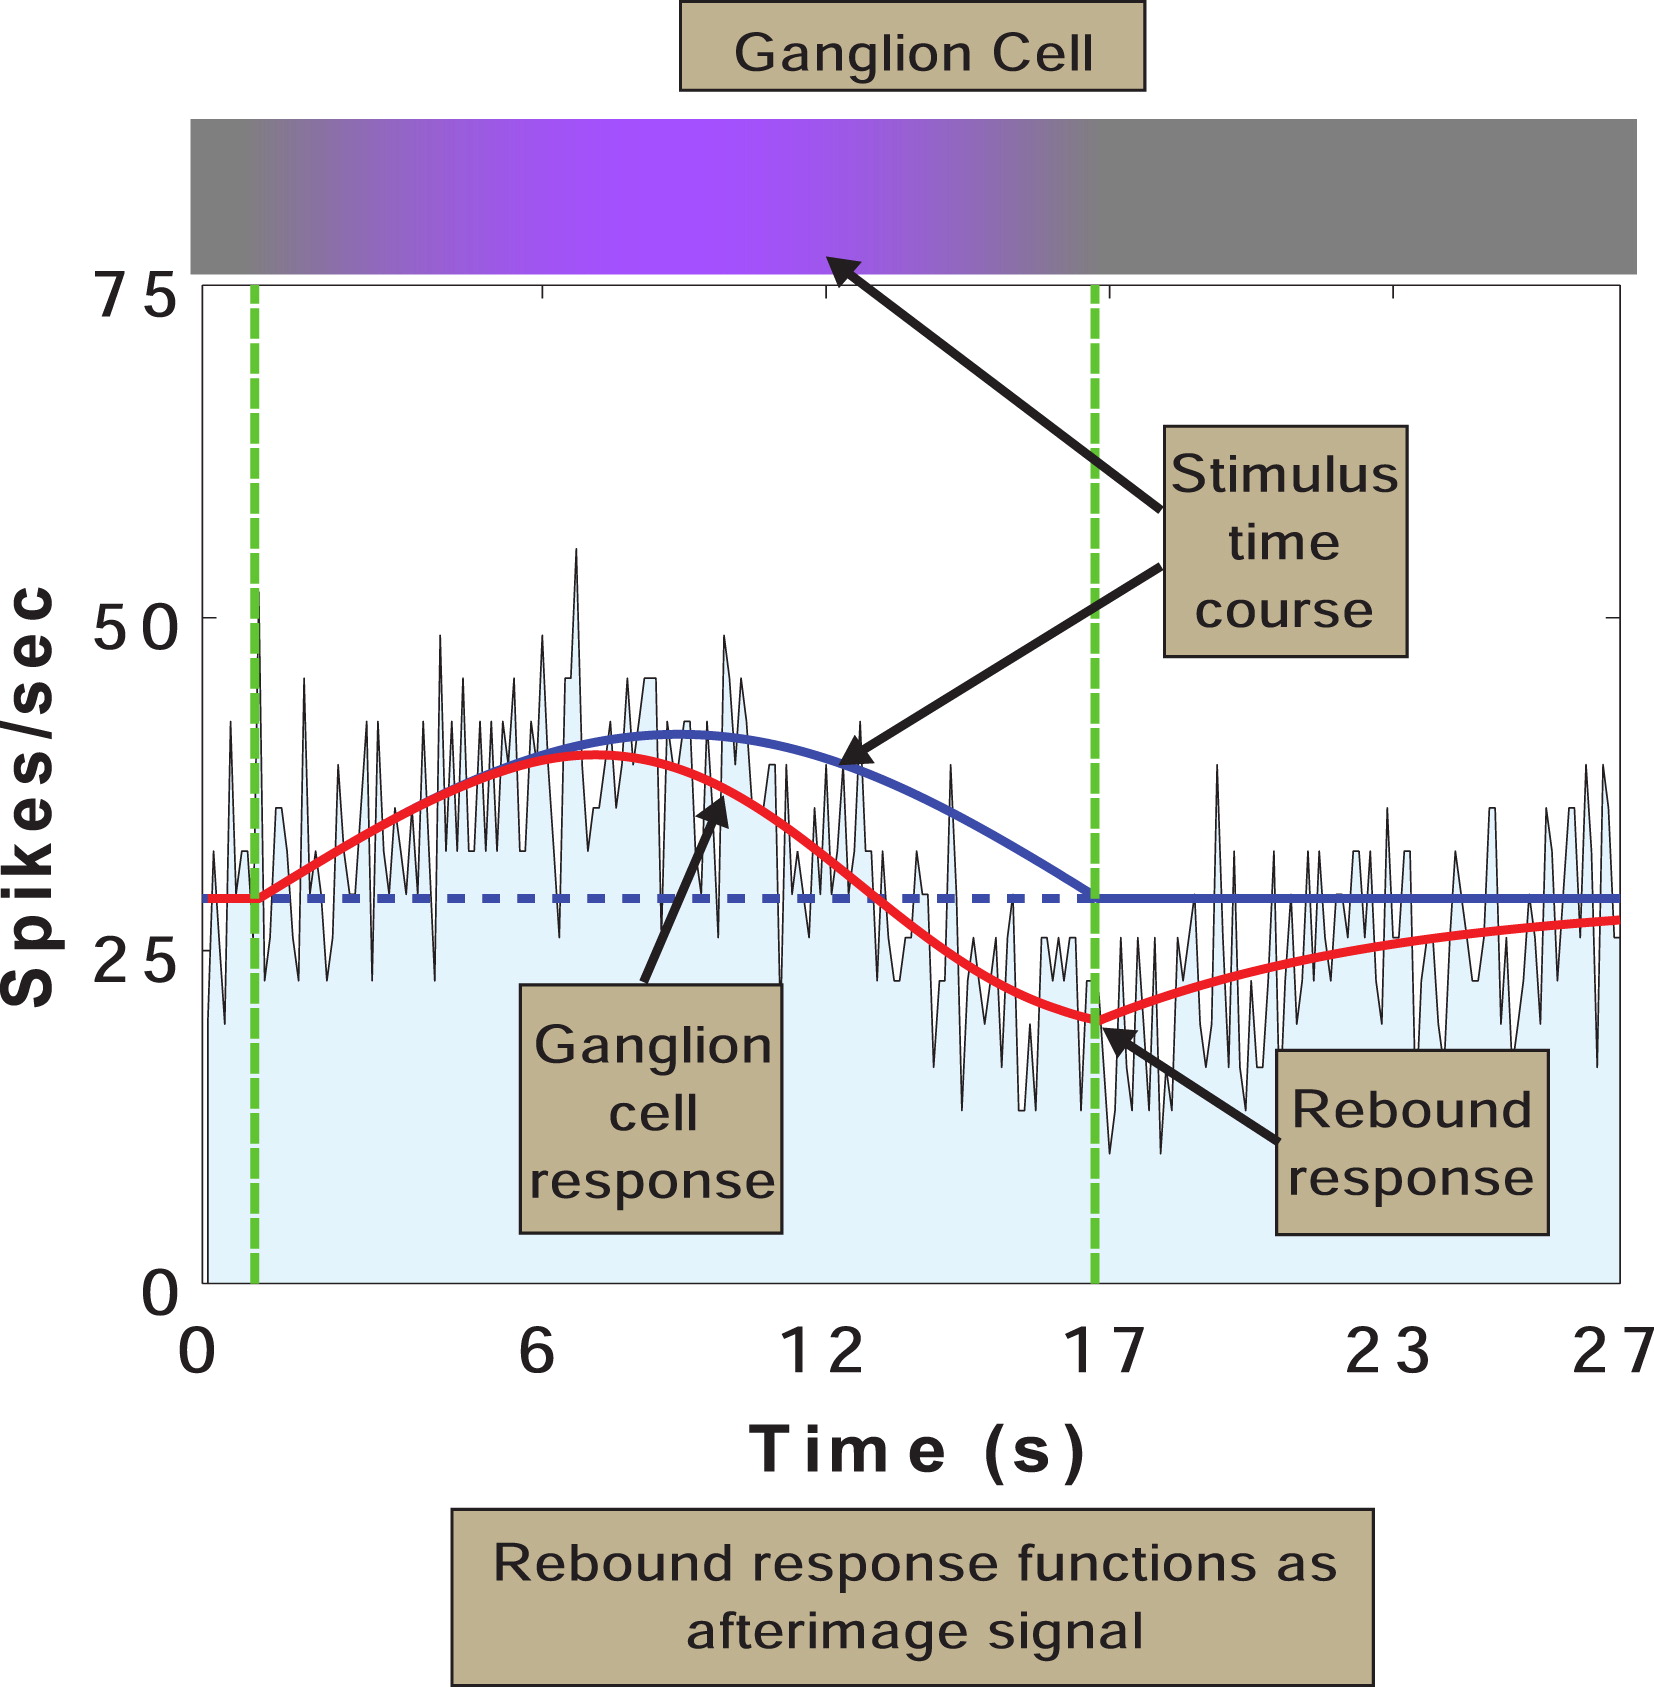
Following up on our adaptation results in Zaidi, Ennis, Cao, & Lee (2012), where it was determined that the retinal ganglion cells (RGCs) are the neural locus of color adaptation, we tested the utility of our stimulus paradigm as a diagnostic method for glaucoma, since glaucoma also damages the RGCs. We compared glaucoma patients and controls and evaluated whether the time-course of color adaptation differs between the two groups. We found that adaptation is weaker and slower for glaucoma patients, even at retinal locations that clinical perimetry would suggest are healthy, indicating that our method could be used as a supplementary early diagnostic tool for glaucoma.
Statistical tools used:
- Model fitting
- ANOVA and t-test comparison of parameter estimates for the different test groups
Programming tools used:
- R
- Matlab
Geometrical structure of perceptual color space
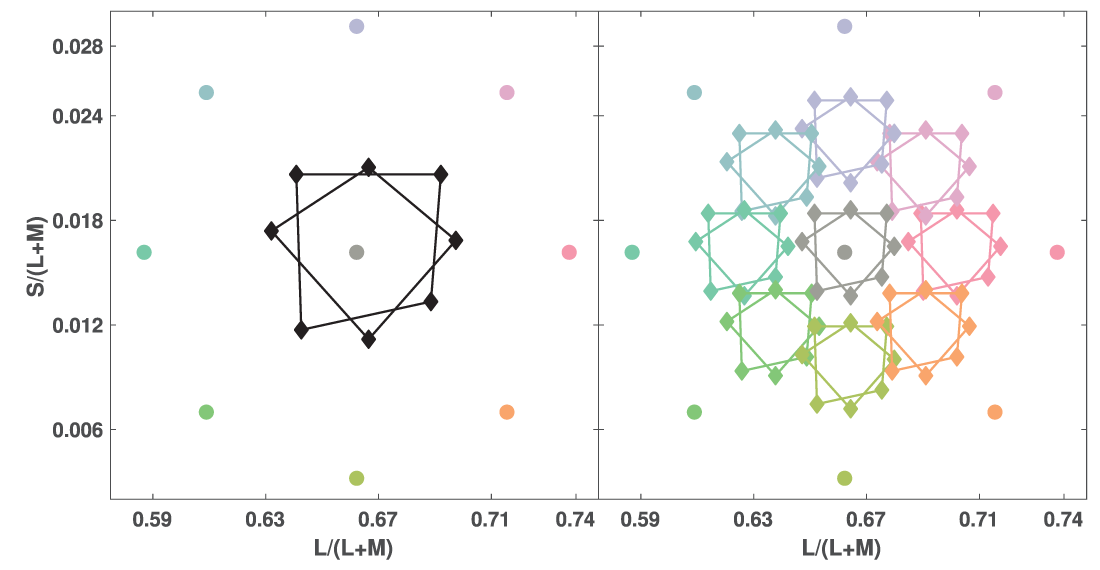
Attempts to build perceptually uniform color spaces have almost always been based on small, local diffences between patches of color. The traditional task then is to develop a metric that embodies these differences and that allows one to transform the warped, Affine color matching space into a well-structured Euclidean space, where distance corresponds to perceived difference between colors. We took a different approach of considering similarity between colors, rather than differences. since similarity has more psychological and biological relevance. We evaluated judgements for "medium" and "large" distances between colors and our similarity midpoint results (based on Varignon's Theorem) showed that perceptual color space is not Euclidean, but is at least Affine, and that similarity judgements are invariant to adaptation state. Future work on perceptual color spaces needs to simultaneously consider the biological relevance of the task and the intrinsic/extrinsic geometry imposed. In essence, it seems that observers do not organize and relate color by strict metrical differences.
Statistical tools used:
- Strict test of mathematical theorem
- t-tests for some followup evaluations
Programming tools used:
- Matlab
- Psychtoolbox
Disentangling simultaneous changes of surface and illumination
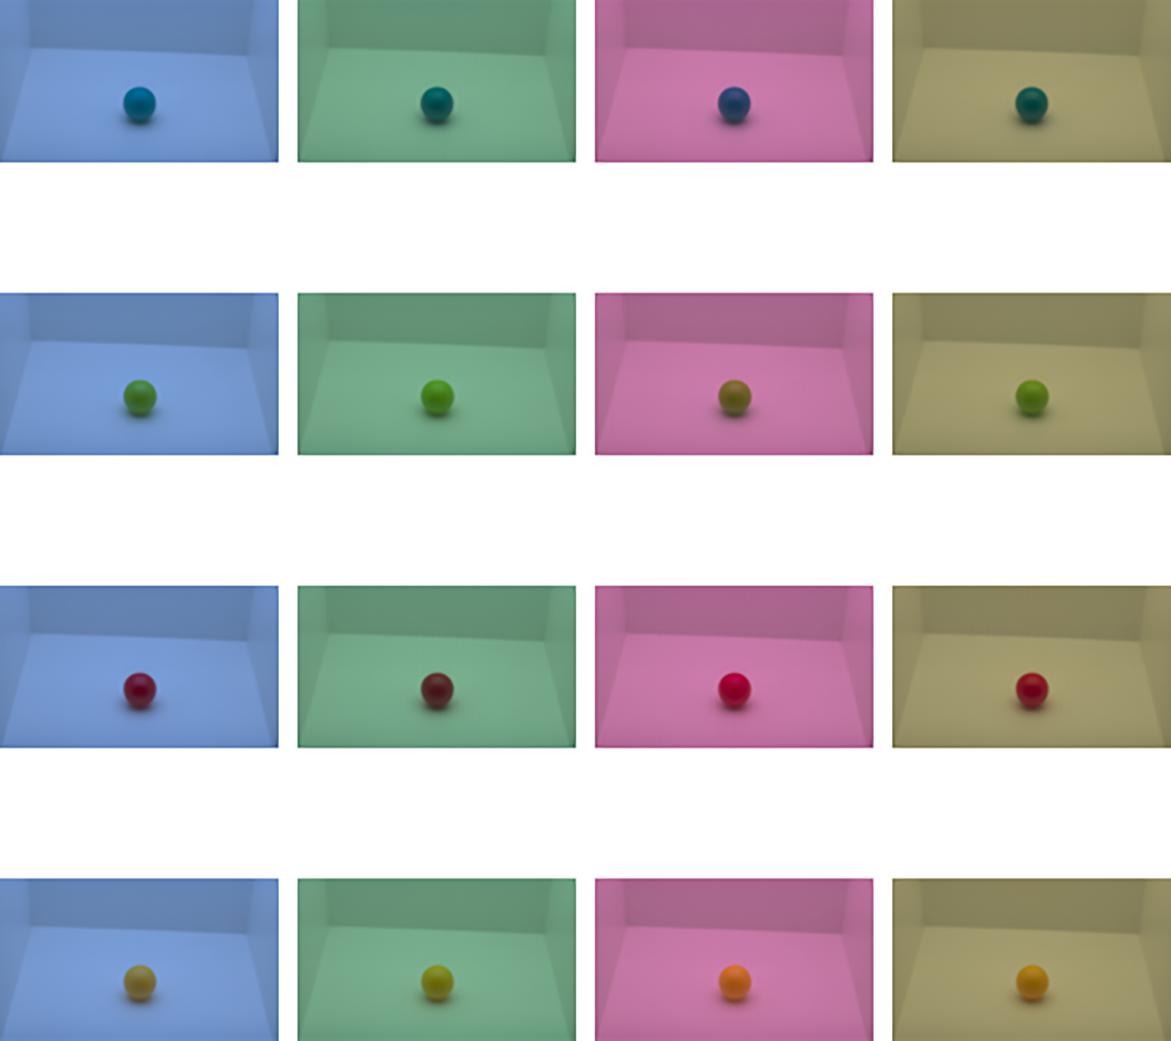
Color constancy is the capacity of an observer to perceive the color of an object as constant, despite changes in the illumination. Essentially, changes in the illumination induce massive alterations in the physical input to the visual system, so the visual system must disentangle the relative contributions of illumination and surface on the light that reaches the eye. Studies of color constancy usually only change the color of the illumination, so we presented observers with a task where the color of the illumination and the color of a surface can simultaneously change and observers had to estimate the relative magnitude of both changes. We found that observers can estimate the relative magnitude of these changes. To explain our results, we applied different color consatncy models that are often favored in the literature and found that these models must be applied locally and that the White Point statistic best explains illumination judgements, while the Mean Color statistic best explains surface judgements, with Cone Excitation Ratios potentially playing a supplemnetary role.
Statistical tools used:
- Generalized Additive Models
- Model comparison via ANOVA
- Image analysis & color statistics
Programming tools used:
- R
- Rust
- OpenGL
- Mitsuba for stimulur rendering
Hyperspectral database of fruits and vegetables
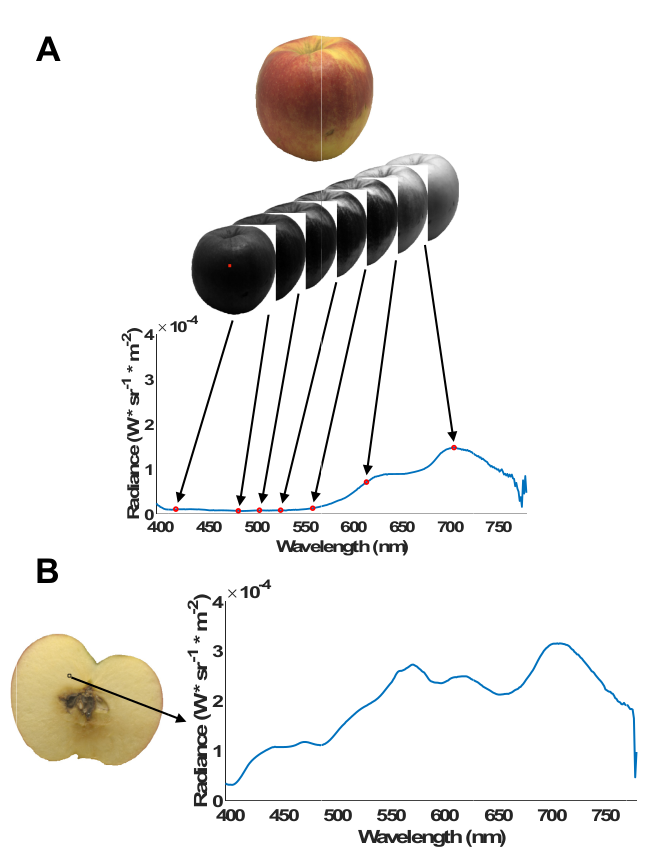
Humans use color to detect, discriminate, and categorize objects, amongst other operations. One evolutionary pressure for color vision was to faciltate finding food and for discriminating ripe from unripe or unedible food. As such, it is important for the visual system to determine the inner state of fruit and vegetables, based on the colors presented on their skins. As a result, our ability to discriminate different colors may also be related to the statistical distribution of colors found on fruits/vegetables. To test these ideas, we built a hyperspectral database of the colors found on the skins and insides of 42 fruits/vegetables and found significant correlations between the hues, saturations, and lightnesses of the skins and insides of fruits/vegetables, and also found a significant correlation between the orientations of their chromatic distributions and the MacAdam discrimination ellipses.
Statistical tools used:
- Image analysis & color statistics
- Hyperspectral image processing
- Circular statistics
- Delauney triangulation
- Ellipse interpolation
- SVD (for hyperspectral image compression)
Programming tools used:
- Matlab
- Rust
- Python (GraphCut)
- Julia
- C and libvips
Related database website
Related Github repo
Categorizing natural color distributions
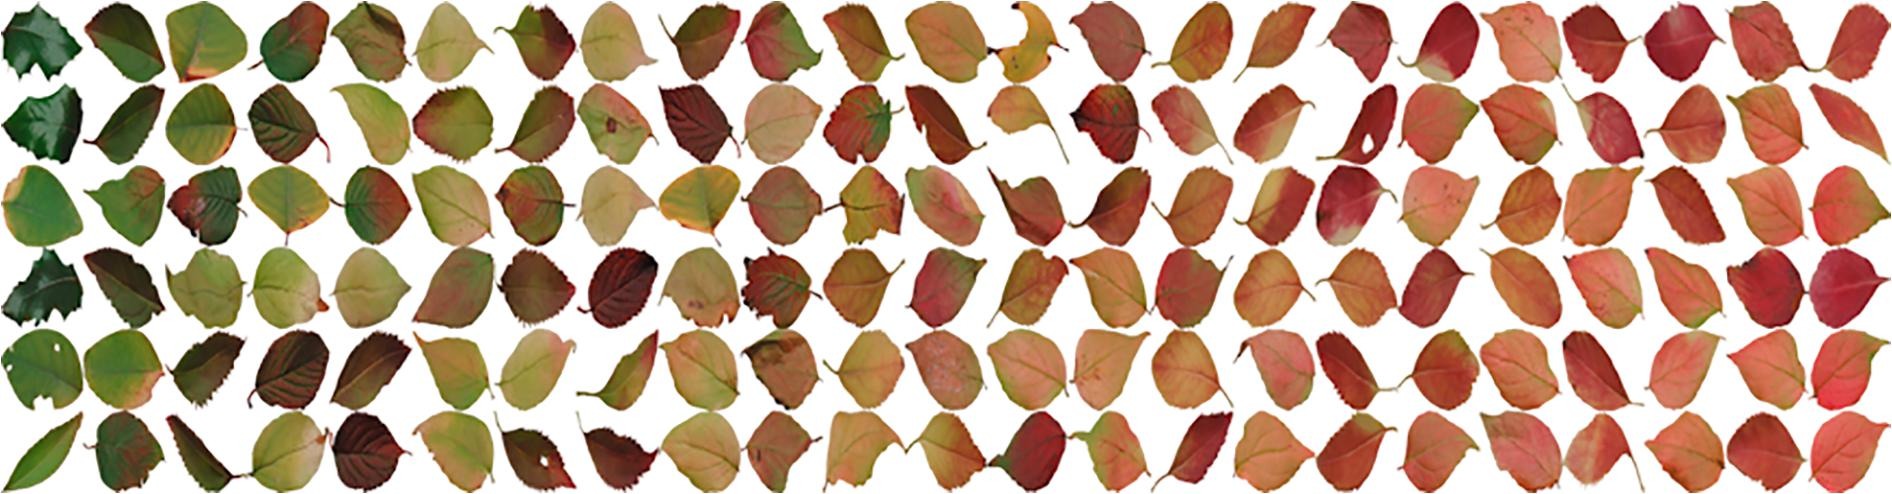
Although most natural objects display a distribution of colors on their surfaces, most of the time, they can be classified as one color (e.g., the "red leaf" or the "green asparagus"). It is still unclear how the visual system takes a chromatic distribution and reduces it to one color category, especially for natural objects. We used Autumn leaves, varying in color from all red to all green, and asked observers to categorize them as "red" or "green". Using some image manipulations to retain some color statistics, while varying others, we determined, via means of a linear classification analysis, that observers take the mean hue of an Autumn leaf and compare it to their unique yellow boundary to classify it as either "red" or "green". We suggest that a similar mechanism is used for other natural objects.
Statistical tools used:
- Image analysis & color statistics
- Linear classifiers (with leave-one out evaluation)
- Circular statistics
- Psychometric function fitting
Programming tools used:
- Matlab
- Psychtoolbox